Difference between revisions of "Road Scholar"
| Line 50: | Line 50: | ||
:'''Mileage Chart'''- This chart gives you the exact mileage between cities. It's found on the side or back of map. Only major cities are located on the mileage chart. If the cities you are trying to find the distance between are not on it, you must use the little numbers next to the highway to find the mileage. | :'''Mileage Chart'''- This chart gives you the exact mileage between cities. It's found on the side or back of map. Only major cities are located on the mileage chart. If the cities you are trying to find the distance between are not on it, you must use the little numbers next to the highway to find the mileage. | ||
:'''Little Numbers'''- Adding together all of the little black numbers or red numbers (on highways) between cities also determines mileage. It's a good idea to write down each of the numbers that you see, as it is easy to miss a number. | :'''Little Numbers'''- Adding together all of the little black numbers or red numbers (on highways) between cities also determines mileage. It's a good idea to write down each of the numbers that you see, as it is easy to miss a number. | ||
| + | :'''Travel Time Chart'''- This chart is on all the maps that I have used. It shows the estimated travel time between locations by the most direct route and without any "pit-stops". Usually it is found on the same side of the map as the state that it serves. It also has only major cities on it. | ||
:'''Grid System'''- Highway maps have a grid system. Go to the number and letter, and bring your fingers together. If you are looking for a specific city, you can find the city on the chart on the side of the map. Next to the city will be the grid description. | :'''Grid System'''- Highway maps have a grid system. Go to the number and letter, and bring your fingers together. If you are looking for a specific city, you can find the city on the chart on the side of the map. Next to the city will be the grid description. | ||
| − | + | :'''Population'''- The population of a city is usually found on the side of the map next to the city name. You can also find the grid location there. | |
:'''Insert Maps'''- These insets are usually found on the back of the state highway maps. They show a close-up view of a city or region. Questions may be asked about a specific intersection or road on that inset. Questions like that can usually not be asked on a highway map because you can't see smaller roads or bridges. | :'''Insert Maps'''- These insets are usually found on the back of the state highway maps. They show a close-up view of a city or region. Questions may be asked about a specific intersection or road on that inset. Questions like that can usually not be asked on a highway map because you can't see smaller roads or bridges. | ||
:'''Legend'''- Like with quads, there is also a legend found on a highway map. It is usually found near one of the corners, although sometimes it's on the back of the map. The legend will define what some symbols mean. It will depends on what is on the map to determine what will be in the legend. However, the different types of highways are always in the legend. | :'''Legend'''- Like with quads, there is also a legend found on a highway map. It is usually found near one of the corners, although sometimes it's on the back of the map. The legend will define what some symbols mean. It will depends on what is on the map to determine what will be in the legend. However, the different types of highways are always in the legend. | ||
Revision as of 02:01, 31 March 2010
Description
Participants are to be able to interpret, collect data, and make conjectures from maps, usually road and/or topographic maps. Competitors must also be able to draw maps. Participants are given 50 minutes to answer questions pertaining to the map.
Road Scholar is one of the classic Science Olympiad events. Road Scholar or another mapping event has been used in all but two years of Science Olympiad history. Recently, it has only been an event in division B. The most similar event in divison C would be Remote Sensing. Geocaching and Get Your Bearing are also somewhat similar to Road Scholar. Geocaching was a trial event at George Washington University 2008.
The Event
Road Scholar is split up into three sections: Topographic maps, or quadrangles, state highway maps, and map drawing. All three of these sections must be completed within the 50 minute time period.
You need to know the very basics of maps to begin working on Road Scholar. You need to know all of the directions. North, South, East, West, Northeast, Southeast, Northwest, and Southwest. Even though this may sound stupid, you also need to know how to fold a map. If the map is folded incorrectly, you may get a penalty for not cleaning up properly. After you know the basics, learn everything found below.
Topographic Maps (Quadrangles)
Quadrangles, or quads for short, could be considered the key component of Road Scholar. There are many things that you need to learn for using quadrangles. Some of these things can be found below. Look below to see what a quadrangle looks like, and where each thing is located on it.
- Map Location- This can be found in the top right corner of the quad. On the first line it will say the location, and on the second it will say the state.
- Colors- There are 6 major colors black, blue, brown, green, red, and purple. Each means a different thing. Black= features like roads and buildings, Blue= water features, Brown= contours, Green= vegetation, Red= important roads, Purple= revisions.
- Neat Lines- These are the outer boundaries of the map. They keep the map "neat".
- Surrounding Quads- You can find out what the other quads are around the quad you're looking at by looking in one of two places depending on the map. There could be a diagram in the bottom margin of the map that will show the eight surrounding quads, or just outside the neat lines, there will be the name of the quad from each of the eight surrounding directions.
- Graticule Tick Marks- There are four of these on the quad. They divide the map into 9 sectors, one for each of the eight directions. Often times on a test it will say to find an object in a "sector". The sectors are labeled from left to right across the map. This is what the sectors look like: Each of the intersections on this diagram are where graticule tick marks would be.

- Latitude and Longitude- Each degree of both latitude and longitude can be split up into 60 minutes. Within each of those 60 minutes, there are 60 seconds. Each of the four corners and each of the four graticule tick marks have their coordinates labeled. For any other location though, it needs to be calculated.
- Latitude is measured in North or South. It is important that you put either a N or an S after the coordinates. To calculate the latitude of somthing, take the distance from the lower sector boundary to object (in mm) and divid it by the N-S distance across sector (in mm) ) x 150 this is the distance to object/in seconds. So you simply take the degrees from the bottem of the sector, and add the number of seconds you get. A latitude might look like this: 39° 45' 30" N.
- Longitude is measured in East or West. As with Latitude, it is important that you label E or W after the coordinates. You can calculate longitude by taking the distance from easterly sector boundary to object (in mm)and divid it by the E-W distance across sector (in mm), then multiply that by 150. This is the distance to object in seconds also. So you have to take the longitude from the eastern sectorly boundry, and add the number of seconds you get. A longitude might look like this: 110° 39' 25" W.
- Series- All quads used in Road Scholar are in the 7.5 minute series.
- Scale- All quads used in Road Scholar have a scale of 1:24000.
- Legend- This can be found in the bottom right corner of the quad. It shows what each of the types of roads are. Primary, unimproved, etc.
- Contour Lines- These brown lines indicate the elevation.
- Index contour lines are darker brown than intermediate. The elevation is written on the line.
- Intermediate countour lines are a little bit of a lighter brown color. The elevation is not written on the line.
- Contour Interval- This is found in the center of the bottom margin of the quad. This number indicates the number of feet between each contour line. If you're finding the elevation of something, you must look at the contour interval first.
- Magnetic Declination- There is a diagram located at the center of the bottom margin of the quad. This diagram will have three (sometimes two) lines coming out of it. The one straight up is true north. One of the other two will say MN. This is magnetic north. The magnetic declination is the number of degrees between true north and magnetic north, and it is written right next to line MN.
- Map Symbols- The map symbols needed during the event can be found here: Map Symbols
- Survey Control Marks- These are specific points on a quad that give the exact elevation of a place that is not found on a countour line. You need to know control station marks, spot elevations, and benchmarks. The symbols for each of these can be found in the topographic map symbols booklet.
- Azimuth- Is the degrees from one object to another. This is found using a full circle (360) protactor. An azimuth can be up to 359 degrees. It looks like this: 25°. You should line up the protractor so that 0 is facing north. Then, use a ruler or string to find the exact degrees between the two places.
- Bearing- It's found by using a full circle protractor. The direction N or S is added in front of the degrees, and E or W is adden afterward. It looks l ike this: N25°E. Like an azimuth, you should use a ruler or sting to find the exact degrees. 0 degrees is always facing north or south, and 90 degrees is always facing west or east. You can only measure it from 0 to 90 degrees.
- Measuring Distances- To measure distances on a quadrangle, you'll need a piece of scrap paper. Line up the piece of paper between the two objects placing a small dash where each of them are. Then, bring the piece of paper down to the measurement convertor in the bottom margin. Line up the piece of paper with whichever distance you want to measure in. If the space between the two dashes is larger than the measurement line, make another dash where the end of the line is. Then, measure to as exact a distance as possible.
- Stream Gradient- Use the formula "change in elevation/distance x 1000" to find the answer. You will need to use sting for this to accuratley find the distance along the stream/river.
- Slope Gradient- Use the formula "change in elevation/distance x 100" to find the answer.
- Public Land Survey System (PLSS)- On the bottom and side neat lines of the quad, you will see something that might say T. 5 S and R. 5 E. T stands for township and R stands for Range. Within each of these divisions, there are 36 sections. You can find the number of the section on the quad in red in the center of the section. Each section has four quarters, NE, NW, SE, and SW. Within each of those quarters are another four quarters, once again being NE, NW, SE, and SW. After you have all of this information for a specific location, you could write it out like this: NE 1/4 NW 1/4 14 T. 5 S R. 6 E. Pretend that there is an "of the" between the NE 1/4 and the NW 1/4. This means that it is the NE 1/4 of the NW 1/4 of Section 14. Please note that not all states use PLSS so not all quads have PLSS on them.
- Stream Flow Direction- The contour lines located on the stream will always point upstream. For example, if the countour line is pointing NW, the stream will be flowing to the SE.
- Universal Transverse Mercator (UTM)- UTM is made up of sixty different zones, based off of the transverse mercator projection, a map projection which instead of having the center of the projection at the equator, like in the mercator promjection, the prime meridian is the center. The grid system reaches from just below South America (80° S) to Canada (84° N) Each piece of the grid is 6° of longitude wide.

Highway Maps
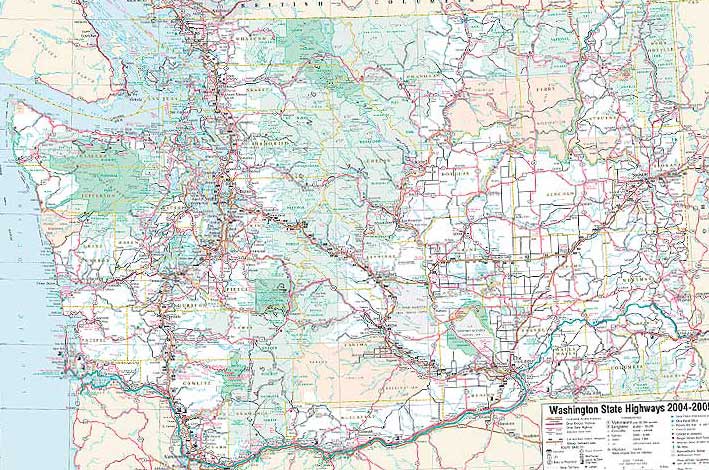
State Highway Maps are also a large part of the event. There is slighly less to learn about highway maps than quads. This is an example of one: State Highway Map
- Mileage Chart- This chart gives you the exact mileage between cities. It's found on the side or back of map. Only major cities are located on the mileage chart. If the cities you are trying to find the distance between are not on it, you must use the little numbers next to the highway to find the mileage.
- Little Numbers- Adding together all of the little black numbers or red numbers (on highways) between cities also determines mileage. It's a good idea to write down each of the numbers that you see, as it is easy to miss a number.
- Travel Time Chart- This chart is on all the maps that I have used. It shows the estimated travel time between locations by the most direct route and without any "pit-stops". Usually it is found on the same side of the map as the state that it serves. It also has only major cities on it.
- Grid System- Highway maps have a grid system. Go to the number and letter, and bring your fingers together. If you are looking for a specific city, you can find the city on the chart on the side of the map. Next to the city will be the grid description.
- Population- The population of a city is usually found on the side of the map next to the city name. You can also find the grid location there.
- Insert Maps- These insets are usually found on the back of the state highway maps. They show a close-up view of a city or region. Questions may be asked about a specific intersection or road on that inset. Questions like that can usually not be asked on a highway map because you can't see smaller roads or bridges.
- Legend- Like with quads, there is also a legend found on a highway map. It is usually found near one of the corners, although sometimes it's on the back of the map. The legend will define what some symbols mean. It will depends on what is on the map to determine what will be in the legend. However, the different types of highways are always in the legend.
- Scale- It shows how many miles and kilometers are represented by an inch. It is usually found next to the legend.
Map Drawing
It is absolutely crucial that you have the map symbols for the map drawing. The map drawing may ask you to draw a specific type of building, which you will need the map symbols sheet for. There is one practice exercise available in the Road Scholar section of Road Scholar SOINC. It is a good idea to practice on your own too. Try making up your own exercise, and drawing it. An example of a square found in the competition can be found in the helpful hints section. Usually, the map squares are equivalent to one PLSS section on a quadrangle.
Here is a practice map drawing test:
The square represents section 12. The scale of the map is 1:15625. This means that 1 inch is equal to 1/4 of a mile, or 1 inch is equal to 15625 feet.
- Starting from the SW corner of the map, draw a primary highway at an azimuth of 77°.
- Place a perennial lake directly South of the primary highway in the SE 1/4 SE 1/4 12.
- Place an orchard in the SW 1/4 NE 1/4 12, so that it only covers the western 20 acres.
- Draw two houses, a church, and a cemetery on the south side of the primary highway in the SE 1/4 SW 1/4 12. On the north side in the same spot, draw a house and a school.
- Place a benchmark with an elevation of 300 feet directly to the East of the orchard.
- Draw in a power transmission line which enters 15625" west of the NE corner at an azimuth of 213°.
- Draw a graticule tick mark in the NW 1/4 NW 1/4 12.
Types of series
| series | Scale | 1 inch is about | 1 cm is about | size (lat by long) | Area (miles squared) |
|---|---|---|---|---|---|
| Puerto Rico 7.5min | 1:20000 | 1667 ft | 200 meters | 7.5x7.5 | 71 |
| 7.5 min series | 1:24000 | 2000 ft | 240 meters | 7.5x7.5 | 49 to 70 |
| 7.5 min series | 1:25000 | 2083 ft | 250 meters | 7.5x7.5 | 49 to 70 |
| 7.5x15 min series | 1:25000 | 2083 ft | 250 meters | 7.5x15 | 98 to 140 |
| USGS/DMA 15min | 1:50000 | 4166 ft | 500 meters | 15x15minx | 197 to 282 |
| 15min | 1:62500 | 1 mile | 625 meters | 15x15 | 197 to282 |
Helpful Hints
It is wise to split the test between you and your partner while in a competition because of the time limit. You may think that 50 minutes is a long time, but when you get into the competition the time seems to fly by. Try to use different state maps while practicing so that you have more experience with different states and terrain. Also, purchase or find different tests to practice with. Finally, try to memorize important formulas such as stream gradient, slope gradient, latitude and longitude.
Drawing the land survey maps:
- be prepared make the squares beforehand
- have one person draw it
here is an example
I got this sheet from Laboratory Manual for Physical Geology by Zumberge and Rutford

This is an example of a topographic profile from Laboratory Manual for Physical Geology by Zumberge and Rutford

The Competition
You should make sure that you are bringing the right things into the competition. Because you're allowed to bring anything you want, you should take all the notes that you have. However, make sure you know the material so you don't have to rely on your binder! It is also absolutely necessary that you bring a ruler, a 360 degree protractor, string (to measure stream gradient), and extra paper (to measure distances and as scratch paper.) A magnifying glass can sometimes be useful, and a map symbol sheet is needed for the map-drawing. A calculator is also helpful because it saves time.
It's a great idea to purchase the Coaches Handbook for Road Scholar off of here. This gives detailed lessons on how to do everything in the event. It's really useful to bring into the competition because it has everything you need to know in one place. It also comes with a map symbols sheet, which you'll already need for the competition.
Practice
Participants should become familiar with reading topographic maps as well as road maps, and knowing what symbols mean on a map. See the USGS (http://www.usgs.gov/) for a list of road map symbols. A good study tool is the coaches handbook which goes in depth with all the things you need to know.
Many practice tests can be found on http://www.tufts.edu/as/wright_center/products/sci_olympiad/sci_olympiad_road_scholar.html. You may need to order maps from http://www.usgs.gov/ to complete the tests.
Exercises
For most of these, you can use them over again just change the points between which you have to profile to make it harder or easier or to quiz your partner!
| fill in this map and than create a profile for it | draw in the contour lines | another topo profile exercise | harder topo profile exercise | river topo profiling ex |
| glacier profiling | another river profiling | Another easy profile | ||
 |


Helpful sites
- http://imnh.isu.edu/digitalatlas/geog/basics/topo.htm Includes some general information, how to make a topographic profile, measuring stream gradient, and a sample map.
- http://www.cs.nmsu.edu/~jbj/index_auxil/idaho_virtual_campus/topo_profiles.htm this link gives a great description of how to profile.
- http://education.usgs.gov/common/undergraduate.htm#maps this has tons of links to other places.