Difference between revisions of "Road Scholar"
Eyeball138 (talk | contribs) |
m (A few grammar errors) |
||
| (112 intermediate revisions by 37 users not shown) | |||
| Line 1: | Line 1: | ||
| − | {{ | + | {{Infobox event |
| − | |2009thread=[http://scioly.org/phpBB3/viewtopic.php?f=17&t=137 2009] | + | | active = yes |
| − | |2010thread=[http://scioly.org/phpBB3/viewtopic.php?f=67&t=1277 2010] | + | | type = Earth Science |
| − | + | | cat = Study | |
| − | == | + | | description = Participants will answer interpretive questions that may use one or more state highway maps, USGS topographic maps, Internet-generated maps, a road atlas, or satellite/aerial images. |
| − | + | | 2009thread = [http://scioly.org/phpBB3/viewtopic.php?f=17&t=137 2009] | |
| + | | 2010thread = [http://scioly.org/phpBB3/viewtopic.php?f=67&t=1277 2010] | ||
| + | | 2011thread = [http://scioly.org/phpBB3/viewtopic.php?f=93&t=2203 2011] | ||
| + | | 2012thread = [http://scioly.org/phpBB3/viewtopic.php?f=121&t=2973 2012] | ||
| + | | 2013thread = [http://www.scioly.org/phpBB3/viewtopic.php?f=144&t=3709 2013] | ||
| + | | 2014thread = [http://www.scioly.org/phpBB3/viewtopic.php?f=167&t=4970 2014] | ||
| + | | 2015thread = [http://scioly.org/phpBB3/viewtopic.php?f=187&t=5896 2015] | ||
| + | | 2016thread = [http://scioly.org/phpBB3/viewtopic.php?f=208&t=7692 2016] | ||
| + | | 2017thread = [http://scioly.org/phpBB3/viewtopic.php?f=227&t=9303 2017] | ||
| + | | 2018thread = [https://scioly.org/forums/viewtopic.php?f=265&t=10876 2018] | ||
| + | | 2019thread = [https://scioly.org/forums/viewtopic.php?f=285&t=12229 2019] | ||
| + | | 2020thread = [https://scioly.org/forums/viewtopic.php?f=285&t=15373 2020] | ||
| + | | 2021thread = [https://scioly.org/forums/viewtopic.php?f=348&t=18306 2021] | ||
| + | | 2022thread = [https://scioly.org/forums/viewtopic.php?f=386&t=23480 2022] | ||
| + | | 2023thread = [https://scioly.org/forums/viewtopic.php?t=26025 2023] | ||
| + | | 2015questions = [http://scioly.org/phpBB3/viewtopic.php?f=193&t=6376 2015] | ||
| + | | 2016questions = [https://scioly.org/forums/viewtopic.php?f=217&t=7974 2016] | ||
| + | | 2017questions = [http://scioly.org/phpBB3/viewtopic.php?f=228&t=9652 2017] | ||
| + | | 2018questions = [https://scioly.org/forums/viewtopic.php?f=266&t=10951 2018] | ||
| + | | 2019questions = [https://scioly.org/forums/viewtopic.php?f=297&t=12404 2019] | ||
| + | | 2020questions = [https://scioly.org/forums/viewtopic.php?f=297&t=16547 2020] | ||
| + | | 2022questions = [https://scioly.org/forums/viewtopic.php?f=387&t=23445 2022] | ||
| + | | 2023questions = [https://scioly.org/forums/viewtopic.php?t=26080 2023] | ||
| + | |2024thread=[https://scioly.org/forums/viewtopic.php?t=27622 2024] | ||
| + | |2024questions=[https://scioly.org/forums/viewtopic.php?t=27645 2024] | ||
| + | | 1stBName = Cooper Middle School | ||
| + | | 2ndBName = Longfellow Middle School | ||
| + | | 3rdBName = Beckendorff Junior High School | ||
| + | | Website = https://www.soinc.org/road-scholar-b|participants=2|eventtime=50 minutes|rotates=No|resources=* Two Class II Calculators | ||
| + | * protractors | ||
| + | * rulers | ||
| + | * other measuring devices | ||
| + | * USGS Map Symbol Sheets | ||
| + | * Hand lenses/magnifying glasses | ||
| + | * Notes | ||
| + | * marking devices consistent with colors utilized on USGS topographic maps (State and National Tournaments) | ||
| + | |firstappearance=1994 | ||
| + | |latestappearance=2024 | ||
| + | |1stCName=Troy High School | ||
| + | |2ndCName=Maine-Endwell High School | ||
| + | |3rdCName=Grand Haven High School}} | ||
| + | In '''Road Scholar''', participants are to be able to interpret, collect data, and make conjectures from maps, usually, but not limited to, highway (Rand McNally and/or AAA) and/or topographic maps, as well as Google Maps/Mapquest and satellite images. Competitors must also be able to draw maps, usually in topographic map format. Participants are given 50 minutes to answer questions pertaining to the maps. | ||
| − | Road Scholar is one of the classic Science Olympiad events. | + | Road Scholar is one of the classic Science Olympiad events. Road Scholar or another mapping event has been used in all but two years of Science Olympiad history. Recently, it has only been an event in [[Division B]]. The most similar events in [[Division C]] would be [[Remote Sensing]] and [[Geologic Mapping]]. [[Geocaching]] and [[Get Your Bearing]] are also somewhat similar to Road Scholar. Geocaching was a trial event at the [[George Washington University 2008|2008 National Tournament]] and [[University of Nebraska 2015|2015 National Tournament]]. |
| − | + | The event was named [[Road Rally]] between 1991 and 1993 as a division B/C event. | |
| − | Road | ||
| − | + | == Event Basics == | |
| + | This event can be split into four main sections: Topographic maps (quadrangles), state highway maps, map drawing, and satellite imagery. Other activities such as topographic profiling may also be included. The test is completed within a fifty-minute time limit. | ||
| − | + | In order to begin working on Road Scholar, it is helpful to know the basics of looking at maps. Memorizing the primary and secondary directions is important: North, South, East, West, Northeast, Southeast, Northwest, and Southwest. Stupid as it seems, you may also need to know how to fold a map. If the map is folded incorrectly, a penalty may be issued for not cleaning up properly, which is required at some tournaments. After getting comfortable with the basics, you can move on to learning about the specific parts of the event. | |
| − | |||
| − | :'''Map Location'''- This can be found in the top right corner of the quad. | + | == Topographic Maps (Quadrangles) == |
| − | + | Quadrangles, or quads for short, are a key component of Road Scholar. There are many things that you need to learn for using quadrangles, some of which can be found below. Look below to see what a quadrangle looks like, and where to find what is located on it. | |
| − | :'''Neat Lines'''- These are the outer boundaries of the map. | + | |
| − | :'''Surrounding Quads'''- You can find out | + | [[File:Road_Scholar_example_map.JPG]] |
| − | :'''Graticule Tick Marks'''- There are four | + | |
| + | :'''Map Location''' - This can be found in the top right corner of the quad. On the first line it will say the location, and on the second it will say the state. | ||
| + | :'''Neat Lines''' - These are the outer boundaries of the map. They keep the map "neat". | ||
| + | :'''Surrounding Quads''' - You can find out about the eight bordering quads by looking in one of two places depending on the map. There could either be a diagram in the bottom margin of the map that will show the eight surrounding quads, OR just outside the neat lines, there will be the name of the quad from each of the eight surrounding directions. | ||
| + | :'''Graticule Tick Marks''' - There are four graticule tick marks on each quad. These divide the map into 9 sectors, one for each of the eight directions and one for the center. Often times, a test will ask to find an object in a "sector". The sectors are labeled from left to right across the map. This is what the sectors look like: Each of the intersections on this diagram are where graticule tick marks would be. | ||
[[File:Road Scholar sectors.jpg]] | [[File:Road Scholar sectors.jpg]] | ||
| − | :'''Latitude and Longitude'''- | + | :'''Latitude and Longitude''' - Latitude and Longitude measure the distance north and south of the equator, and east and west of the prime meridian, respectively. They can be broken down into three increments: The most basic form, degrees, are identified by a small “o” following and above a number (80°). Degrees can be broken down into minutes. There are sixty minutes per degree. Minutes are identified by an apostrophe (80°15’). They can be broken down into seconds. Likewise, there are sixty seconds per minute. Seconds are identified by two apostrophes (80°15’30’’). Always be as specific as possible when writing latitude and longitude measurements. |
| − | + | :* '''Latitude''' measures distances North or South of the equator. It is important to put either an N or an S after the coordinates, or you will be penalized. To calculate the latitude of a location, take the distance from the lower sector boundary to the target object (preferably in mm) and divide it by the N-S distance across sector (in mm) and multiply this value by 150. This is the distance to the target object in seconds. Then, you can simply derive the value of the degrees from the bottom neat line, and add the number of seconds you have measured. A latitude might look like this: 39°45'30"N. | |
| − | + | :* '''Longitude''' measures distances East and West of the prime meridian. As with Latitude, it is important to label E or W after the coordinates, or points will be taken off. Longitude can be calculated by taking the distance from easterly sector boundary to the target object (preferably in mm) and dividing it by the E-W distance across sector (in mm), then multiplying that answer by 150. This is the distance to the object in seconds as well, so it's important to take the longitude from the eastern sector boundary, and add the number of seconds you measure. A longitude might look like this: 110°39'25" W. | |
| − | :''' | + | :'''Series''' - Most quads used in Road Scholar use the 7.5 minute series. |
| − | + | :'''Scale''' - Most quads used in Road Scholar have a scale of 1:24,000. Both scale and series are common questions on tests, so be sure to know the right answer. There may be some tests (but very few), however, in which a quad of a different series and scale will be used (e.g. a 30 minute x 60 minute series of scale 1:100,000). | |
| − | + | :'''Legend''' - This can be found in the bottom right corner of the quad. This may show important information on how to read the quad. For example, it may explain what types of roads are featured on the map. | |
| − | + | :'''Contour Interval''' - This is found in the center of the bottom margin of the quad. This number indicates the number of feet (or, rarely, on some maps, meters) between each contour line. If you're finding the elevation of something, you must look at the contour interval first. In addition, like series and scale, many tests will ask what the contour interval is. Unlike series and scale, however, this number may vary widely across maps. | |
| − | + | :* '''Contour Lines''' are lines throughout the map that indicate the elevation of a location. Combined with the contour interval, you will be able to find the elevation of every point on the map through contour lines. | |
| − | : | + | :* '''Index Contour Lines''' - These dark contour lines will also display the elevation. They are extremely important when calculating elevation. |
| − | + | :'''Magnetic Declination''' - There is a diagram located at the center of the bottom margin of the quad. This diagram will have three (sometimes two) lines coming out of it. The one straight up is true north. One of the other two will say MN. This is magnetic north. The magnetic declination is the number of degrees between true north and magnetic north, and it is written right next to the line as MN. | |
| − | :''' | + | :'''Geographic Declination''' - This will be the other line in the diagram mentioned above. The geographic declination is the number of degrees between true north and geographic north, and it is written next to the line at GN. |
| − | + | :'''Public Land Survey System (PLSS)''' - For many tests, teams will be asked to write out a location using PLSS. This may seem difficult to write at first, but it’s easy to figure out with practice. First, identify the township and range of the target object or section. If you look on the neat lines of the quad, you will see something that might say "T. 5 S" and "R. 5 E". T stands for township and R stands for range. Be sure to get the right township and range, because this will be needed later. Within each of these divisions, there are 36 sections, usually outlined by orange borders. The number of the section can be found on the quad in the center of the section. Finally, each section can be split into four quarters: NE, NW, SE, and SW. Within each of those quarters there can be another four quarters, once again being NE, NW, SE, and SW. Locate which 1/16 (that is, a quarter of a quarter) the point is in, i.e. NW ¼ of the NE ¼ or SW ¼ of the SW ¼. More specific measures may also be asked for in tests, but questions generally do not ask for more than two or three specifications. | |
| − | :''' | + | |
| − | :''' | + | :Now you have all the information to write a full PLSS location. First, start with the 1/16 the point is in; for example, SE ¼ NW ¼. Then, add the section number to the end (SE ¼ NW ¼ 20). Finally, add township and range that were on the quad to the end: SE ¼ / NW ¼ / 20 / T 6 S R 8 W. Congratulations, you have successfully written out your location in PLSS form! |
| − | + | ||
| − | + | :''Please note that not all states use PLSS so not all quads have PLSS on them.'' | |
| − | + | ||
| − | + | === Additional Information === | |
| − | + | [[File:Topo symbols.jpg|thumb|200px|right|A chart showing many of the topo symbols]] | |
| − | + | ||
| − | :''' | + | There is much more to learn about topographic maps besides the above. The following elements are not mentioned on the example map, but still important. |
| + | |||
| + | :'''Map Colors''' - Major colors on a topographic map include black, blue, brown, green, red, and purple, each with a different meaning. Black can denote features like roads and buildings, blue identifies water features, brown identifies contours, green identifies vegetation, red denotes important roads, and purple indicates revisions to the map. | ||
| + | :'''Map Symbols''' - The map symbols needed during the event can be found [http://egsc.usgs.gov/isb/pubs/booklets/symbols/ here]. It is ''very'' important to have at least one symbols sheet during the competition. Many questions will ask about certain symbols, and having a symbols sheet is practically an unwritten law for the build-a-map portion of the test. An example of a topo sheet is on the right. | ||
| + | :'''Survey Control Marks''' - These are specific points on a quad that give the exact elevation of a place that is not found on a contour line. Teams need to know control station marks, spot elevations, and benchmarks. The symbols for each of these can be found in the topographic map symbols booklet. | ||
| + | :'''Azimuth''' - Azimuth is the degrees from one object to another. This is found using a full circle (360) protractor. An azimuth can be up to 359 degrees, and it looks like this: 25°. It is important to line up the protractor so that 0 is facing north. Then, use a ruler or other straightedge to find the exact degree measure between the two places. | ||
| + | :'''Bearing''' - Bearing is also found by using a full circle protractor. The direction N or S is added in front of the degrees, and E or W is added afterward. It looks like this: N 25° E. Like an azimuth, it is important to use a ruler or string to find the exact degrees. 0 degrees is always facing north or south, and 90 degrees is always facing west or east. Bearing can only be measured from 0 to 90 degrees, since it is always measured from the 180 degree line. For example, if the angle is 91 degrees (in the sense of an azimuth), than the bearing measurement would be S 89 degrees E. | ||
| + | :'''Measuring Distances''' - To measure distances on a quadrangle, you'll need a piece of scrap paper. Line up the piece of paper between the two objects placing a small dash where each of them are. Then, bring the piece of paper down to the map scale in the bottom margin. Line up the piece of paper with the proper scale to measure how long of a distance the line represents. If the space between the two dashes is larger than the measurement line, make another dash where the end of the line is. Then, measure to as exact a distance as possible. | ||
| + | :'''Stream Gradient''' - Stream gradient is found in feet per thousand feet, or ft/1000 ft. To find stream gradient, first measure the length section of the stream in question. Then, figure out the change in elevation between the beginning and ending points of the portion of the stream. Input these amounts into the formula "change in elevation over distance x 1000" (C.I.E/Distance x 1000) to find the answer. String is needed for this to accurately find the distance along the stream/river. | ||
| + | :'''Slope Gradient''' - Similar to stream gradient, use the formula "change in elevation over distance x 100" to find the answer. This measurement, however, is along a straight line and the method mentioned in the Measuring Distances section can be used to calculate the distance instead of a string. | ||
| + | :'''Stream Flow Direction''' - The contour lines located on the stream will always point upstream. For example, if the contour line is pointing NW, the stream will be flowing to the SE. | ||
| + | :'''Inset Map''' - A smaller map that is focused on a smaller area, these are usually larger cities or places that require more details. Many times, these are used on the Road Scholar test as regular vocabulary or as a place you may want to focus on. | ||
| + | |||
| + | === Profiling Quadrangles === | ||
| + | Teams may be asked to profile a quadrangle as part of the test. To make a topographic profile, follow the following steps: | ||
| + | |||
| + | # Place a piece of scrap paper between the two points that identify where the profile is to be created | ||
| + | # Mark on the paper at every point where the paper crosses a contour line | ||
| + | # Label these marks with the elevation of the contour | ||
| + | # Place the edge of the paper along graph paper | ||
| + | # Make the Y-Axis of the graph elevation and the X-Axis distance | ||
| + | # Make a scatter plot of the points, and connect them with a line | ||
| + | |||
| + | This is an example of a topographic profile from ''Laboratory Manual for Physical Geology by Zumberge and Rutford'' | ||
| + | [[File:topoprofileex.jpg|thumb|200px|center|topoex]] | ||
| + | |||
| + | === Universal Transverse Mercator === | ||
| + | You may notice smaller numbers on the margins of the map, something along the lines of two smaller numbers, two larger numbers, and several smaller numbers. These are UTM markings, or Universal Transverse Mercator. The blue tick marks along the neat lines of the map are also used for UTM. The numbers on the left and right sides are north-south markings, called ‘’northing’’. The numbers on the top and bottom of the map are east-west markings, or ‘’easting’’. The UTM projection uses the metric system, so if you aren’t familiar with it by now, which you should be, get used to it. As accuracy increases (the length of the numbers), the area indicated by the numbers decreases. | ||
| + | |||
| + | Here’s an example of UTM:j ''10 S 0559741 4282182''. The first number and letter represent the zone, which is defined globally (see [http://www.dmap.co.uk/utmworld.htm this link] for an explanation of zones). The first long string of numbers is easting, and the second is northing. | ||
| + | |||
| + | To accurately locate a position using UTM, you may need to use a grid overlay tool. This tool allows you to find a location within a 100m square accurately. [http://www.maptools.com/products/UTMGrids.html These are available here], among other places. [http://www.maptools.com/UsingUTM/index.html See this link for more information on UTM]. | ||
| + | |||
| + | '''MRGS''' is an abbreviated form of UTM. It is rarely seen on the tests though. | ||
| − | + | ==== UPS ==== | |
| + | Universal Polar Stereographic system is for the poles. It operates on the basics of UTM. There is easting and northing, which are only two areas it covers. It covers two circles one at the north pole and one at the south. The middle of the south pole are at "South 2,000km E 2,000km N" or for the north pole, "North 2,000km E 2,000km N". | ||
| − | + | == Highway Maps == | |
| − | State Highway Maps are also a large part of the event. | + | State Highway Maps are also a large part of the event. There is slightly less to learn about highway maps than quads. Here is an example of one: [http://www.bentler.us/washington-state/maps/img/washington-state-road-map.jpg State Highway Map] |
| − | :'''Mileage Chart'''- This chart | + | :'''Mileage Chart''' - This chart displays the exact mileage between cities. It's found on the side or back of map, and only major cities are located on the mileage chart. If the cities in question are not on it, you must use the numbers next to the highways on the map to find the mileage. Adding together all of the little black numbers or red numbers (on highways) between cities also determines mileage. It's a good idea to write down each of the numbers, as it is easy to miss a number. |
| − | + | :'''Travel Time Chart''' - This chart shows the estimated travel time between locations by the most direct route and without any "pit-stops". Usually it is found on the same side of the map as the state that it serves. It also has only major cities on it. | |
| − | :'''Grid System'''- Highway maps have a grid system. | + | :'''Grid System''' - Highway maps have a grid system. To find the grid location of a place, look to the sides of the map to see what letter and number correspond to that place. If looking for a specific city, you can find the city on the chart on the side of the map. Next to the city will be the grid description. |
| − | :'''Population'''- The population of a city is usually found on the side of the map next to the city name. | + | :'''Population''' - The population of a city is usually found on the side of the map next to the city name. The grid location can also be found there. |
| − | :''' | + | :'''Inset Maps''' - These insets are usually found on the back of the state highway maps, and they show a close-up view of a city or region. Questions may be asked about a specific intersection or road on that inset. If you cannot locate something on the main highway map, the inset maps are the next place to check. |
| − | :'''Legend'''- Like with quads, there is also a legend found on a highway map. | + | :'''Legend''' - Like with quads, there is also a legend found on a highway map. It is usually found near one of the corners, although sometimes it is on the back of the map. The legend will define what some symbols mean. It depends on what is on the map to determine what will be in the legend. However, the different types of highways are always in the legend. |
| + | :'''Scale''' - It shows how many miles and kilometers are represented by an inch. It is usually found next to the legend. | ||
| − | + | == Map Drawing == | |
| − | It is | + | Map drawing, or “Student-Created Map”, can be included in Road Scholar tests. It is imperative to have a map symbols sheet for this portion of the test. You will be given a blank square and asked to create a map based on instructions given on the test. |
Here is a practice map drawing test: | Here is a practice map drawing test: | ||
| − | The square represents section 12. The scale of the map is 1: | + | The square represents section 12 of township 5 N and range 6 E. The scale of the map is 1:15840. This means that 1 inch is equal to 1/4 of a mile, or 1 inch is equal to 15840 inches. |
| + | |||
| + | 1. Starting from the SW corner of the map, draw a primary highway at an azimuth of 77°. | ||
| + | 2. Place a perennial lake directly South of the primary highway in the SE 1/4 / SE 1/4 / 12. | ||
| + | 3. Place an orchard in the SW 1/4 / NE 1/4 / 12, so that it only covers the western 20 acres. | ||
| + | 4. Draw two houses, a church, and a cemetery on the south side of the primary highway in the SE 1/4 / SW 1/4 / 12. On the north side in the same spot, draw a house and a school. | ||
| + | 5. Place a benchmark with an elevation of 300 feet directly to the East of the orchard. | ||
| + | 6. Draw in a power transmission line which enters 1/4 miles west of the NE corner at an azimuth of 147°. | ||
| + | 7. Draw a graticule tick mark in the center of NW 1/4 / NW 1/4 / 12. | ||
| + | |||
| + | If you are confident in your abilities to complete this exercise, skip to the answer key at the end of this section. Otherwise, here is a step-by-step solution to solving this type of problem. | ||
| + | |||
| + | === Solution === | ||
| + | |||
| + | First, before looking at the specific tasks of the exercise, it is usually helpful to split the square into a 4-square by 4-square grid. Most map drawing exercises use the PLSS system, have a scale of 1 inch equals 1/4 mile, and provide a 4 inch by 4 inch square. So by splitting up the grid into 16 smaller squares, you are really splitting up the section into each of its subdivisions (NW 1/4 / NW 1/4, NE 1/4 / NW 1/4, etc.), which will make it much easier to place the symbols. | ||
| + | |||
| + | Next, if it has not already been done for you, it is important to provide the section number and scale. The section number should go in the center of the square, and the scale should be placed just below the square. Also, if provided, the township and range numbers for the section should be labeled. For example, if the section is given as being in "Township 4 North, Range 3 West", you would write "T 4 N" directly to the left of the square, near the top of the square, and "R 3 W" directly above the square, near the left edge. | ||
| + | |||
| + | Now that the map is set up, it's time to go through the problem steps. Here is a step-by-step explanation. | ||
| + | # '''Starting from the SW corner of the map, draw a primary highway at an azimuth of 77°.''' Check the USGS Topographic Symbols to see that a primary highway is represented by a thick solid line. To find the 77° azimuth, align a protractor such that the center is at the SW corner, and the 0° mark is directly North. Make a mark at 77°; this will be how you align the road. Draw two straight lines very close to each other, using a ruler, that connect the SW corner with the mark you just made. Then, extend these lines to the east edge of the map, and fill in the space between the lines. | ||
| + | # '''Place a perennial lake directly South of the primary highway in the SE 1/4 SE 1/4 12.''' Again, checking the symbols, a perennial lake is represented by a shape with a thin solid border and solid shading in the middle. "SE 1/4 SE 1/4 12" means that it has to be in the southeast quarter of the southeast quarter of the section, so find the small square you drew in the beginning all the way in the bottom right. Now, draw in the lake anywhere in this small square, as long as it is south of the highway. It can have whatever shape you want, as the test did not specify. | ||
| + | # '''Place an orchard in the SW 1/4 NE 1/4 12, so that it only covers the western 20 acres.''' Orchards are represented by a rectangular grid of circles. Find "SW 1/4 NE 1/4", i.e. the southwest quarter of the northeast quarter; you should be in the square just to the top left of the 12 you wrote in the center. Now, the test specified the western 20 acres, which may seem arbitrary, but each subdivision you made is exactly 40 acres, so the western 20 acres is just the left half of the square. You can think about this as "W 1/2 SW 1/4 NE 1/4", even though this is not a PLSS-standard location. So now, just draw a square array of circles in this western half of the subdivision. The exact size of the circles shouldn't matter as long as the graders can see they are circles; the answer key below has circles that are on the larger side, but smaller is also fine. | ||
| + | # '''Draw two houses, a church, and a cemetery on the south side of the primary highway in the SE 1/4 SW 1/4 12. On the north side in the same spot, draw a house and a school.''' This step tests organization of symbols. First, find "SE 1/4 SW 1/4 12"; it should be just to the left of bottom-center. You should notice that the primary road goes straight through this subdivision; this is a good sign. To draw the two houses, church, and cemetery on the south side, simply follow the USGS symbols: houses are small solid squares, churches are squares with a cross on top, and cemeteries are dashed rectangles (sometimes with the letters "Cem" or a cross in the center; this is optional). The order does not matter, although it makes sense to have the church and cemetery next to each other. For the house and school on the north side, do the same thing; a school is just a square with a flag on top. This part is not hard, but ''make sure to keep track of your symbols and directions''. | ||
| + | # '''Place a benchmark with an elevation of 300 feet directly to the East of the orchard.''' A benchmark for these purposes falls under "''vertical control''". Draw an X just east of the orchard, and write the number "300" next to it. The test does not specify if the mark has a tablet or not, so putting the "BM" next to the X is optional; however, if the test specifies, it's important to keep track of the correct symbol. | ||
| + | # '''Draw in a power transmission line which enters 15625" west of the NE corner at an azimuth of 147°.''' This seems intimidating at first because of the 15625", but remember that you are working with a scale of 1:15625, so this only means that the line enters 1 inch west of the NE corner of the square. Now measure the azimuth like in step 1, and make a mark at 147°. This is a power transmission line, which means it is a thin solid line connecting small solid dots. Since it does not specify the number of poles or towers, assume that only poles are present, and include them at a reasonable spacing. | ||
| + | # '''Draw a graticule tick mark in the NW 1/4 NW 1/4 12.''' An easy one to finish it off! A graticule tick mark is simply a plus sign, since it marks the intersection of important geographic coordinates. Just find "NW 1/4 NW 1/4 12", which is the top left corner of the whole square, and put a plus sign anywhere. | ||
| + | |||
| + | Congratulations, you have completed your first map! Student-created map exercises can vary greatly in difficulty and scope, so it's important to practice a wide variety of exercises. Most practice tests available will have an example, which can be used for practice. And as always, practice makes perfect; with more practice, you can get more skilled at making maps quickly, efficiently, and accurately, which can set apart a great team from a good one. | ||
| + | |||
| + | Here is the answer key: | ||
| + | {{SpoilerBoxBegin}}'''Map Drawing Answer Key''' | ||
| + | {{SpoilerBoxContent}}[[File: Road_scholar_map_building.gif]] | ||
| + | {{SpoilerBoxEnd}} | ||
| + | |||
| + | == Satellite Images == | ||
| + | {{Incomplete|section}} | ||
| + | For this portion of the event, students must analyze satellite images and answer questions about them. This portion is similar in some ways to other portions. | ||
| + | === Feature Identification === | ||
| + | In this portion, students must be able to identify features of satellite images. | ||
| + | |||
| + | '''Bodies of Water''' | ||
| + | |||
| + | Bodies of water consist of lakes, rivers, streams, and oceans. These are fairly easy to identify because they are often unique shapes and shades of blue. | ||
| + | |||
| + | Let's take a look at a sample image with water. | ||
| + | |||
| + | [[File:Bodiesofwater.PNG|600px]] | ||
| + | |||
| + | |||
| + | It is clear that the segments of blue are rivers and the large area of blue is an ocean. But there is still more to bodies of water. In tropical areas where water is pure, such as areas in Florida, you will see patches of light and dark blue. This is the difference in sediment. | ||
| + | |||
| + | |||
| + | [[File:sediment.PNG|600px]] | ||
| + | |||
| + | Sediments are deposits of sand, mud, or other small particles. They reflect light to color the water. Without it, in the open ocean, there is less reflection so the water appears darker. | ||
| + | |||
| + | '''Vegetation''' | ||
| + | |||
| + | Vegetation consists of all plant material. Trees, grass, and farmland all fall into this category. Vegetation is usually easy to identify because it is usually a shade of green. Grasslands are a slightly lighter green while forests are dark green due to the population density. Finally, farmlands are usually quadrilateral shaped and range from green to pale yellow. See the example below. | ||
| + | |||
| + | [[File:Vegetation.PNG|600px]] | ||
| + | |||
| + | |||
| + | Also, vegetation can have different appearances based on seasons. In summer, vegetation is a full green. In spring, vegetation is a paler green. In winter, vegetation is usually white with very pale mint green. And finally, in Autumn, vegetation is what you would expect: hues of red, brown, and orange. | ||
| + | |||
| + | [[File:Seasons.PNG|700px]] | ||
| + | |||
| + | |||
| + | '''Bare Ground''' | ||
| + | |||
| + | Bare ground consists of places where there is little to none vegetation. As one might expect, it is usually a shade of brown on a satellite image. | ||
| + | |||
| + | [[File:Bareground.PNG|600px]] | ||
| + | |||
| − | + | The color of the bare ground depends on the mineral content of the soil. For example, soil can be red because of the presence of iron oxide in the soil, and in places where soil is very pale, there is an abundance of silicon, calcium, and/or sodium chloride. The image below is an example of this. | |
| − | |||
| − | |||
| − | |||
| − | |||
| − | |||
| − | |||
| − | + | [[File:Examplebareground.PNG|600px]] | |
| − | |||
| − | |||
| − | |||
| − | |||
| − | |||
| − | |||
| − | |||
| − | |||
| − | |||
| − | |||
| − | |||
| − | |||
| − | |||
| − | |||
| − | |||
| − | |||
| − | |||
| − | |||
| − | |||
| − | |||
| − | |||
| − | |||
| − | |||
| − | |||
| − | |||
| − | |||
| − | |||
| − | |||
| − | |||
| − | |||
| − | |||
| − | |||
| − | |||
| − | |||
| − | |||
| − | |||
| − | |||
| − | |||
| − | |||
| − | |||
| − | |||
| − | |||
| − | |||
| − | |||
| − | |||
| − | |||
| − | |||
| − | |||
| − | |||
| − | | | ||
| − | |||
| − | + | '''Civilization''' | |
| − | |||
| − | + | Of course, on a satellite map there isn't only going to be natural features. The impact of human civilization has left cities, towns, and other places of residency. An easy way to identify civilization is looking for densely packed locations on a map that usually do not contain many colors other than white. Also, most major cities have a "spoke and wheel" look where there seem to be lines extending from one central point. This is because of the roads leading into and out of the city (the spokes) and a loop highway around the city (the wheel). | |
| − | |||
| − | |||
| − | + | [[File:Civilization.PNG|600px]] | |
| − | [[ | ||
| − | + | === Distances and Scales === | |
| − | + | In this portion, competitors utilize scales on the provided map to determine distance and other related measurements. As the name might suggest, this section is very similar to the topographic and highway map sections of the event as far as distances and scales go. | |
| − | + | Usually, a scale is found in a corner of the map, such as in the lower right corner in the case of Google Maps. To find the distance from one point to another, a process similar to the process of doing so on a topographic or highway map is used. Students may want to use a scrap of paper on which to copy the scale given, then they will be able to use the paper as a ruler or straightedge to measure the distance from one point to another. | |
| − | |||
| + | In the case that a scale is not given, rarely, another way to determine distance is to approximate. Although this does not seem reliable at first glance, there is some given information regarding distance. For example, the distance between interchanges with consecutive exit numbers on highways is approximately one mile. Using this information, one can measure the distance between one interchange and another to approximate the length of one mile on a satellite | ||
| + | === Time of Day === | ||
| + | In this portion, competitors must use the information on a satellite map to approximate the time of day the satellite map was taken. | ||
| − | + | The most common way of approximating the time of day on a satellite map is to observe the shadow projection of objects. Since satellite maps are usually oriented so that it aligns with the arms of a compass rose, north on a satellite map is north in real life. Because the sun revolves around us (in our perspective), we can come to the conclusion that the shadow of an object can align with a clock to give us the time of day. For example, if the shadow of an object projects directly north, then the time of day is either midnight or midday, depending on the lighting in the given area. | |
| − | |||
| − | + | For example, in the picture below, we can observe the trees to see that the shadows point to about an azimuth of 300 degreees. Iff we draw an imaginary clock over it and let the shadow be the hour hand, then it would be pointing to 10. Therefore, we can approximate the time to be around 10:00 AM. For this to work, north must be facing up. | |
| − | == | + | [[File:Satellite.PNG]] |
| − | + | == Tips for the Competition == | |
| + | * It is wise to split the test relatively evenly while in a competition because of the time limit. 50 minutes may seem like a long time, but time can fly by in the competition. | ||
| + | * Try to use different state maps while practicing to get more experience with different states and terrain. Additionally, purchase or find different tests for practice. Finally, try to memorize important formulas such as: stream gradient, slope gradient, UTM, latitude and longitude, conversions, etc. | ||
| + | * Teams are allowed to bring a binder, so there’s no reason to come to a competition unprepared. If the binder contains lots of information, make an index to make it easier to find information. You may also want to bring the following crucial equipment: A ruler, a protractor, pencils, scratch paper, a calculator (preferably a TI-30X or TI-34), a length of string for measuring distances, a (USGS) map symbol sheet, and perhaps a magnifying glass for locating objects in small print. | ||
| + | * Don’t hesitate to ask if you are missing materials or need clarification on a test question. The event supervisors should have no reason to disqualify you if you need a map or want clarification on the wording of a question. | ||
| + | * Pay attention. It’s easy to accidentally misread NE as NW, for example. Always make sure to identify what the test is asking and how to write the proper answer for every question. You should also double-check the answers, if time allows. | ||
| + | * Practice your identification skills with games such as “I Spy”. It will pay off when trying to locate a hard-to-find object on the map. | ||
| + | * The majority of the time, the Road Scholar test will be in a story-format, with the answers being certain words of the story that have been omitted. Usually the first page of the test will have no questions and all background into the characters in the story. Although some of the problems may need context, it is not wise to read the entire story, as that sucks up valuable time. Go to the first question immediately, read the few lines before the question and, if more context is needed, go back further. | ||
| + | * Familiarize with, as well as bring a copy of, [https://pubs.usgs.gov/gip/TopographicMapSymbols/topomapsymbols.pdf the USGS Topographic Map Symbols sheet]. Sometimes, a question will have something to do with an obscure object that you will not know the symbol for. With this "cheat sheet," you can quickly find the symbol in question, and that will be very helpful in the search of that object. | ||
| − | + | == Practice == | |
| + | Participants should become familiar with reading topographic maps as well as road maps, and knowing what symbols mean on a map. See the [http://www.usgs.gov/ USGS website] for a list of road map symbols. A good study tool is the coaches’ handbook which goes in depth into all of the important topics. | ||
| − | + | Many practice tests can be found in the [[Test Exchange Archive#Road Scholar|Test Exchange Archive]], along with many other practice tests for many other events. Maps may need to be ordered from [http://www.usgs.gov/ USGS] to complete the tests. | |
| − | |||
| − | |||
| − | |||
| − | |||
| − | |||
| − | |||
| − | |||
| − | |||
| − | |||
| − | | align="center" |[[ | + | === Profiling Exercises === |
| − | | align="center" |[[ | + | Most of these profiling exercises can be used multiple times. Just change the points between which the profile is being made to make it easier or harder. |
| − | | align="center" |[[ | + | {|class="wikitable" |
| − | | align="center" |[[ | + | |+'''Topo Exercises''' |
| − | | align="center" |[[ | + | | align="center" |[[File:topo ex1.jpg|thumb|100px|center|Topo Ex. 1]] |
| + | | align="center" |[[File:contour lines.jpg|thumb|100px|center|Topo Ex. 2]] | ||
| + | | align="center" |[[File:topoprofileex2.jpg|thumb|100px|center|Topo Ex. 3]] | ||
| + | | align="center" |[[File:topoprofileex3.jpg|thumb|100px|center|Topo Ex. 4]] | ||
| + | | align="center" |[[File:Riverprofiling.jpg|thumb|100px|center|River Profile Ex. 1]] | ||
|- | |- | ||
| − | + | |align="center"|[[File:glacierprofiling.jpg|thumb|100px|center|Glacier Profile]] | |
| − | + | |align="center"|[[File:riverprofiling1.jpg|thumb|100px|center|River Profile Ex. 2]] | |
| − | + | |align="center"|[[File:aep.jpg|thumb|100px|center|Topo Ex. 5]] | |
| − | + | |align="center"|[[File:hardtoprofile.jpg|thumb|100px|center|Topo Ex. 6]] | |
| − | |align="center"|[[ | ||
| − | |align="center"|[[ | ||
| − | |align="center"|[[ | ||
| − | |align="center"|[[ | ||
|} | |} | ||
| − | == | + | === Practice Tests === |
| + | * [[User:Builderguy135]] and [[User:Sciolyperson1]]'s Road Tests 2020: | ||
| + | ** Eagle Invitational: [https://drive.google.com/open?id=1pK4fdKhur1RBfgA7dBNX35emuBLHuzZ_] | ||
| + | ** Jeffrey Trail Invitational: [https://drive.google.com/open?id=1X6WgBJNLE5-dpuNp_OEgkOK6zRmvJDuV] | ||
| + | ** Rustin Invitational: [https://drive.google.com/drive/folders/1jpxLXIQqPHINhUQAp3MH1BO0U_za_cTI] | ||
| + | ** Raymond Park Invitational: [https://drive.google.com/drive/folders/1PSJ15uMXL9zzIMa-m8cLvf1PX7CiWqVo?usp=sharing] | ||
| + | ** JT/O/K Scrimmage: [https://drive.google.com/open?id=1XuMM_qYwQLGFIHc6AQPQauwp3HQ-XUYb] | ||
| + | |||
| + | == External Links == | ||
| + | :[http://imnh.isu.edu/digitalatlas/geog/basics/topo.htm Includes some general information], how to make a topographic profile, measuring stream gradient, and a sample map. | ||
| + | :[http://www.cs.nmsu.edu/~jbj/index_auxil/idaho_virtual_campus/topo_profiles.htm How to profile] | ||
| + | :[http://education.usgs.gov/common/undergraduate.htm#maps More Information] | ||
| + | :[http://www.maptools.com/UsingUTM/ Understanding UTM]. | ||
| − | + | {{Earth and Space Event}} | |
| − | + | {{2021Events}} | |
| − | |||
| − | [[Category: | + | [[Category:Events]] |
| − | [[Category: | + | [[Category:Study events]] |
| + | [[Category:Earth and Space Science Events]] | ||
Latest revision as of 18:51, 9 April 2024
| Road Scholar | |||||||||||||||||
|---|---|---|---|---|---|---|---|---|---|---|---|---|---|---|---|---|---|
| Type | Earth Science | ||||||||||||||||
| Category | Study | ||||||||||||||||
| Description | Participants will answer interpretive questions that may use one or more state highway maps, USGS topographic maps, Internet-generated maps, a road atlas, or satellite/aerial images. | ||||||||||||||||
| Event Information | |||||||||||||||||
| Participants | 2 | ||||||||||||||||
| Approx. Time | 50 minutes | ||||||||||||||||
| Allowed Resources |
| ||||||||||||||||
| Rotates | No | ||||||||||||||||
| First Appearance | 1994 | ||||||||||||||||
| Latest Appearance | 2024 | ||||||||||||||||
| Forum Threads | |||||||||||||||||
| |||||||||||||||||
| Question Marathon Threads | |||||||||||||||||
| |||||||||||||||||
| Official Resources | |||||||||||||||||
| Website | www | ||||||||||||||||
| Division B Results | |||||||||||||||||
| |||||||||||||||||
| Division C Results | |||||||||||||||||
| |||||||||||||||||
In Road Scholar, participants are to be able to interpret, collect data, and make conjectures from maps, usually, but not limited to, highway (Rand McNally and/or AAA) and/or topographic maps, as well as Google Maps/Mapquest and satellite images. Competitors must also be able to draw maps, usually in topographic map format. Participants are given 50 minutes to answer questions pertaining to the maps.
Road Scholar is one of the classic Science Olympiad events. Road Scholar or another mapping event has been used in all but two years of Science Olympiad history. Recently, it has only been an event in Division B. The most similar events in Division C would be Remote Sensing and Geologic Mapping. Geocaching and Get Your Bearing are also somewhat similar to Road Scholar. Geocaching was a trial event at the 2008 National Tournament and 2015 National Tournament.
The event was named Road Rally between 1991 and 1993 as a division B/C event.
Event Basics
This event can be split into four main sections: Topographic maps (quadrangles), state highway maps, map drawing, and satellite imagery. Other activities such as topographic profiling may also be included. The test is completed within a fifty-minute time limit.
In order to begin working on Road Scholar, it is helpful to know the basics of looking at maps. Memorizing the primary and secondary directions is important: North, South, East, West, Northeast, Southeast, Northwest, and Southwest. Stupid as it seems, you may also need to know how to fold a map. If the map is folded incorrectly, a penalty may be issued for not cleaning up properly, which is required at some tournaments. After getting comfortable with the basics, you can move on to learning about the specific parts of the event.
Topographic Maps (Quadrangles)
Quadrangles, or quads for short, are a key component of Road Scholar. There are many things that you need to learn for using quadrangles, some of which can be found below. Look below to see what a quadrangle looks like, and where to find what is located on it.

- Map Location - This can be found in the top right corner of the quad. On the first line it will say the location, and on the second it will say the state.
- Neat Lines - These are the outer boundaries of the map. They keep the map "neat".
- Surrounding Quads - You can find out about the eight bordering quads by looking in one of two places depending on the map. There could either be a diagram in the bottom margin of the map that will show the eight surrounding quads, OR just outside the neat lines, there will be the name of the quad from each of the eight surrounding directions.
- Graticule Tick Marks - There are four graticule tick marks on each quad. These divide the map into 9 sectors, one for each of the eight directions and one for the center. Often times, a test will ask to find an object in a "sector". The sectors are labeled from left to right across the map. This is what the sectors look like: Each of the intersections on this diagram are where graticule tick marks would be.

- Latitude and Longitude - Latitude and Longitude measure the distance north and south of the equator, and east and west of the prime meridian, respectively. They can be broken down into three increments: The most basic form, degrees, are identified by a small “o” following and above a number (80°). Degrees can be broken down into minutes. There are sixty minutes per degree. Minutes are identified by an apostrophe (80°15’). They can be broken down into seconds. Likewise, there are sixty seconds per minute. Seconds are identified by two apostrophes (80°15’30’’). Always be as specific as possible when writing latitude and longitude measurements.
- Latitude measures distances North or South of the equator. It is important to put either an N or an S after the coordinates, or you will be penalized. To calculate the latitude of a location, take the distance from the lower sector boundary to the target object (preferably in mm) and divide it by the N-S distance across sector (in mm) and multiply this value by 150. This is the distance to the target object in seconds. Then, you can simply derive the value of the degrees from the bottom neat line, and add the number of seconds you have measured. A latitude might look like this: 39°45'30"N.
- Longitude measures distances East and West of the prime meridian. As with Latitude, it is important to label E or W after the coordinates, or points will be taken off. Longitude can be calculated by taking the distance from easterly sector boundary to the target object (preferably in mm) and dividing it by the E-W distance across sector (in mm), then multiplying that answer by 150. This is the distance to the object in seconds as well, so it's important to take the longitude from the eastern sector boundary, and add the number of seconds you measure. A longitude might look like this: 110°39'25" W.
- Series - Most quads used in Road Scholar use the 7.5 minute series.
- Scale - Most quads used in Road Scholar have a scale of 1:24,000. Both scale and series are common questions on tests, so be sure to know the right answer. There may be some tests (but very few), however, in which a quad of a different series and scale will be used (e.g. a 30 minute x 60 minute series of scale 1:100,000).
- Legend - This can be found in the bottom right corner of the quad. This may show important information on how to read the quad. For example, it may explain what types of roads are featured on the map.
- Contour Interval - This is found in the center of the bottom margin of the quad. This number indicates the number of feet (or, rarely, on some maps, meters) between each contour line. If you're finding the elevation of something, you must look at the contour interval first. In addition, like series and scale, many tests will ask what the contour interval is. Unlike series and scale, however, this number may vary widely across maps.
- Contour Lines are lines throughout the map that indicate the elevation of a location. Combined with the contour interval, you will be able to find the elevation of every point on the map through contour lines.
- Index Contour Lines - These dark contour lines will also display the elevation. They are extremely important when calculating elevation.
- Magnetic Declination - There is a diagram located at the center of the bottom margin of the quad. This diagram will have three (sometimes two) lines coming out of it. The one straight up is true north. One of the other two will say MN. This is magnetic north. The magnetic declination is the number of degrees between true north and magnetic north, and it is written right next to the line as MN.
- Geographic Declination - This will be the other line in the diagram mentioned above. The geographic declination is the number of degrees between true north and geographic north, and it is written next to the line at GN.
- Public Land Survey System (PLSS) - For many tests, teams will be asked to write out a location using PLSS. This may seem difficult to write at first, but it’s easy to figure out with practice. First, identify the township and range of the target object or section. If you look on the neat lines of the quad, you will see something that might say "T. 5 S" and "R. 5 E". T stands for township and R stands for range. Be sure to get the right township and range, because this will be needed later. Within each of these divisions, there are 36 sections, usually outlined by orange borders. The number of the section can be found on the quad in the center of the section. Finally, each section can be split into four quarters: NE, NW, SE, and SW. Within each of those quarters there can be another four quarters, once again being NE, NW, SE, and SW. Locate which 1/16 (that is, a quarter of a quarter) the point is in, i.e. NW ¼ of the NE ¼ or SW ¼ of the SW ¼. More specific measures may also be asked for in tests, but questions generally do not ask for more than two or three specifications.
- Now you have all the information to write a full PLSS location. First, start with the 1/16 the point is in; for example, SE ¼ NW ¼. Then, add the section number to the end (SE ¼ NW ¼ 20). Finally, add township and range that were on the quad to the end: SE ¼ / NW ¼ / 20 / T 6 S R 8 W. Congratulations, you have successfully written out your location in PLSS form!
- Please note that not all states use PLSS so not all quads have PLSS on them.
Additional Information

There is much more to learn about topographic maps besides the above. The following elements are not mentioned on the example map, but still important.
- Map Colors - Major colors on a topographic map include black, blue, brown, green, red, and purple, each with a different meaning. Black can denote features like roads and buildings, blue identifies water features, brown identifies contours, green identifies vegetation, red denotes important roads, and purple indicates revisions to the map.
- Map Symbols - The map symbols needed during the event can be found here. It is very important to have at least one symbols sheet during the competition. Many questions will ask about certain symbols, and having a symbols sheet is practically an unwritten law for the build-a-map portion of the test. An example of a topo sheet is on the right.
- Survey Control Marks - These are specific points on a quad that give the exact elevation of a place that is not found on a contour line. Teams need to know control station marks, spot elevations, and benchmarks. The symbols for each of these can be found in the topographic map symbols booklet.
- Azimuth - Azimuth is the degrees from one object to another. This is found using a full circle (360) protractor. An azimuth can be up to 359 degrees, and it looks like this: 25°. It is important to line up the protractor so that 0 is facing north. Then, use a ruler or other straightedge to find the exact degree measure between the two places.
- Bearing - Bearing is also found by using a full circle protractor. The direction N or S is added in front of the degrees, and E or W is added afterward. It looks like this: N 25° E. Like an azimuth, it is important to use a ruler or string to find the exact degrees. 0 degrees is always facing north or south, and 90 degrees is always facing west or east. Bearing can only be measured from 0 to 90 degrees, since it is always measured from the 180 degree line. For example, if the angle is 91 degrees (in the sense of an azimuth), than the bearing measurement would be S 89 degrees E.
- Measuring Distances - To measure distances on a quadrangle, you'll need a piece of scrap paper. Line up the piece of paper between the two objects placing a small dash where each of them are. Then, bring the piece of paper down to the map scale in the bottom margin. Line up the piece of paper with the proper scale to measure how long of a distance the line represents. If the space between the two dashes is larger than the measurement line, make another dash where the end of the line is. Then, measure to as exact a distance as possible.
- Stream Gradient - Stream gradient is found in feet per thousand feet, or ft/1000 ft. To find stream gradient, first measure the length section of the stream in question. Then, figure out the change in elevation between the beginning and ending points of the portion of the stream. Input these amounts into the formula "change in elevation over distance x 1000" (C.I.E/Distance x 1000) to find the answer. String is needed for this to accurately find the distance along the stream/river.
- Slope Gradient - Similar to stream gradient, use the formula "change in elevation over distance x 100" to find the answer. This measurement, however, is along a straight line and the method mentioned in the Measuring Distances section can be used to calculate the distance instead of a string.
- Stream Flow Direction - The contour lines located on the stream will always point upstream. For example, if the contour line is pointing NW, the stream will be flowing to the SE.
- Inset Map - A smaller map that is focused on a smaller area, these are usually larger cities or places that require more details. Many times, these are used on the Road Scholar test as regular vocabulary or as a place you may want to focus on.
Profiling Quadrangles
Teams may be asked to profile a quadrangle as part of the test. To make a topographic profile, follow the following steps:
- Place a piece of scrap paper between the two points that identify where the profile is to be created
- Mark on the paper at every point where the paper crosses a contour line
- Label these marks with the elevation of the contour
- Place the edge of the paper along graph paper
- Make the Y-Axis of the graph elevation and the X-Axis distance
- Make a scatter plot of the points, and connect them with a line
This is an example of a topographic profile from Laboratory Manual for Physical Geology by Zumberge and Rutford

Universal Transverse Mercator
You may notice smaller numbers on the margins of the map, something along the lines of two smaller numbers, two larger numbers, and several smaller numbers. These are UTM markings, or Universal Transverse Mercator. The blue tick marks along the neat lines of the map are also used for UTM. The numbers on the left and right sides are north-south markings, called ‘’northing’’. The numbers on the top and bottom of the map are east-west markings, or ‘’easting’’. The UTM projection uses the metric system, so if you aren’t familiar with it by now, which you should be, get used to it. As accuracy increases (the length of the numbers), the area indicated by the numbers decreases.
Here’s an example of UTM:j 10 S 0559741 4282182. The first number and letter represent the zone, which is defined globally (see this link for an explanation of zones). The first long string of numbers is easting, and the second is northing.
To accurately locate a position using UTM, you may need to use a grid overlay tool. This tool allows you to find a location within a 100m square accurately. These are available here, among other places. See this link for more information on UTM.
MRGS is an abbreviated form of UTM. It is rarely seen on the tests though.
UPS
Universal Polar Stereographic system is for the poles. It operates on the basics of UTM. There is easting and northing, which are only two areas it covers. It covers two circles one at the north pole and one at the south. The middle of the south pole are at "South 2,000km E 2,000km N" or for the north pole, "North 2,000km E 2,000km N".
Highway Maps
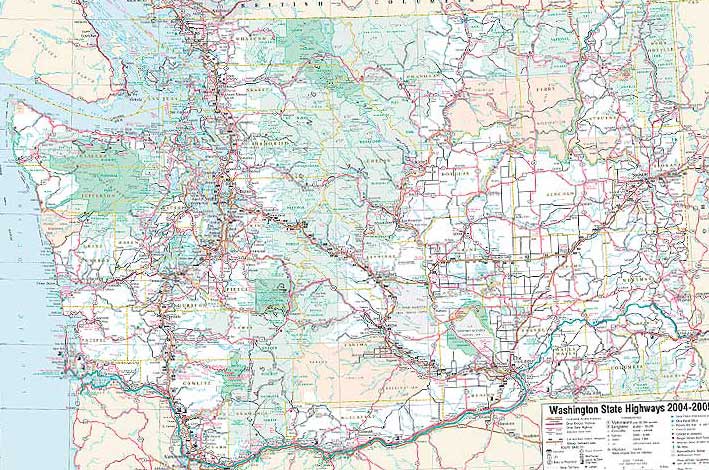
State Highway Maps are also a large part of the event. There is slightly less to learn about highway maps than quads. Here is an example of one: State Highway Map
- Mileage Chart - This chart displays the exact mileage between cities. It's found on the side or back of map, and only major cities are located on the mileage chart. If the cities in question are not on it, you must use the numbers next to the highways on the map to find the mileage. Adding together all of the little black numbers or red numbers (on highways) between cities also determines mileage. It's a good idea to write down each of the numbers, as it is easy to miss a number.
- Travel Time Chart - This chart shows the estimated travel time between locations by the most direct route and without any "pit-stops". Usually it is found on the same side of the map as the state that it serves. It also has only major cities on it.
- Grid System - Highway maps have a grid system. To find the grid location of a place, look to the sides of the map to see what letter and number correspond to that place. If looking for a specific city, you can find the city on the chart on the side of the map. Next to the city will be the grid description.
- Population - The population of a city is usually found on the side of the map next to the city name. The grid location can also be found there.
- Inset Maps - These insets are usually found on the back of the state highway maps, and they show a close-up view of a city or region. Questions may be asked about a specific intersection or road on that inset. If you cannot locate something on the main highway map, the inset maps are the next place to check.
- Legend - Like with quads, there is also a legend found on a highway map. It is usually found near one of the corners, although sometimes it is on the back of the map. The legend will define what some symbols mean. It depends on what is on the map to determine what will be in the legend. However, the different types of highways are always in the legend.
- Scale - It shows how many miles and kilometers are represented by an inch. It is usually found next to the legend.
Map Drawing
Map drawing, or “Student-Created Map”, can be included in Road Scholar tests. It is imperative to have a map symbols sheet for this portion of the test. You will be given a blank square and asked to create a map based on instructions given on the test.
Here is a practice map drawing test:
The square represents section 12 of township 5 N and range 6 E.  The scale of the map is 1:15840.  This means that 1 inch is equal to 1/4 of a mile, or 1 inch is equal to 15840 inches.

1. Starting from the SW corner of the map, draw a primary highway at an azimuth of 77°.
2. Place a perennial lake directly South of the primary highway in the SE 1/4 / SE 1/4 / 12.
3. Place an orchard in the SW 1/4 / NE 1/4 / 12, so that it only covers the western 20 acres.
4. Draw two houses, a church, and a cemetery on the south side of the primary highway in the SE 1/4 / SW 1/4 / 12. On the north side in the same spot, draw a house and a school.
5. Place a benchmark with an elevation of 300 feet directly to the East of the orchard.
6. Draw in a power transmission line which enters 1/4 miles west of the NE corner at an azimuth of 147°.
7. Draw a graticule tick mark in the center of NW 1/4 / NW 1/4 / 12.
If you are confident in your abilities to complete this exercise, skip to the answer key at the end of this section. Otherwise, here is a step-by-step solution to solving this type of problem.
Solution
First, before looking at the specific tasks of the exercise, it is usually helpful to split the square into a 4-square by 4-square grid. Most map drawing exercises use the PLSS system, have a scale of 1 inch equals 1/4 mile, and provide a 4 inch by 4 inch square. So by splitting up the grid into 16 smaller squares, you are really splitting up the section into each of its subdivisions (NW 1/4 / NW 1/4, NE 1/4 / NW 1/4, etc.), which will make it much easier to place the symbols.
Next, if it has not already been done for you, it is important to provide the section number and scale. The section number should go in the center of the square, and the scale should be placed just below the square. Also, if provided, the township and range numbers for the section should be labeled. For example, if the section is given as being in "Township 4 North, Range 3 West", you would write "T 4 N" directly to the left of the square, near the top of the square, and "R 3 W" directly above the square, near the left edge.
Now that the map is set up, it's time to go through the problem steps. Here is a step-by-step explanation.
- Starting from the SW corner of the map, draw a primary highway at an azimuth of 77°. Check the USGS Topographic Symbols to see that a primary highway is represented by a thick solid line. To find the 77° azimuth, align a protractor such that the center is at the SW corner, and the 0° mark is directly North. Make a mark at 77°; this will be how you align the road. Draw two straight lines very close to each other, using a ruler, that connect the SW corner with the mark you just made. Then, extend these lines to the east edge of the map, and fill in the space between the lines.
- Place a perennial lake directly South of the primary highway in the SE 1/4 SE 1/4 12. Again, checking the symbols, a perennial lake is represented by a shape with a thin solid border and solid shading in the middle. "SE 1/4 SE 1/4 12" means that it has to be in the southeast quarter of the southeast quarter of the section, so find the small square you drew in the beginning all the way in the bottom right. Now, draw in the lake anywhere in this small square, as long as it is south of the highway. It can have whatever shape you want, as the test did not specify.
- Place an orchard in the SW 1/4 NE 1/4 12, so that it only covers the western 20 acres. Orchards are represented by a rectangular grid of circles. Find "SW 1/4 NE 1/4", i.e. the southwest quarter of the northeast quarter; you should be in the square just to the top left of the 12 you wrote in the center. Now, the test specified the western 20 acres, which may seem arbitrary, but each subdivision you made is exactly 40 acres, so the western 20 acres is just the left half of the square. You can think about this as "W 1/2 SW 1/4 NE 1/4", even though this is not a PLSS-standard location. So now, just draw a square array of circles in this western half of the subdivision. The exact size of the circles shouldn't matter as long as the graders can see they are circles; the answer key below has circles that are on the larger side, but smaller is also fine.
- Draw two houses, a church, and a cemetery on the south side of the primary highway in the SE 1/4 SW 1/4 12. On the north side in the same spot, draw a house and a school. This step tests organization of symbols. First, find "SE 1/4 SW 1/4 12"; it should be just to the left of bottom-center. You should notice that the primary road goes straight through this subdivision; this is a good sign. To draw the two houses, church, and cemetery on the south side, simply follow the USGS symbols: houses are small solid squares, churches are squares with a cross on top, and cemeteries are dashed rectangles (sometimes with the letters "Cem" or a cross in the center; this is optional). The order does not matter, although it makes sense to have the church and cemetery next to each other. For the house and school on the north side, do the same thing; a school is just a square with a flag on top. This part is not hard, but make sure to keep track of your symbols and directions.
- Place a benchmark with an elevation of 300 feet directly to the East of the orchard. A benchmark for these purposes falls under "vertical control". Draw an X just east of the orchard, and write the number "300" next to it. The test does not specify if the mark has a tablet or not, so putting the "BM" next to the X is optional; however, if the test specifies, it's important to keep track of the correct symbol.
- Draw in a power transmission line which enters 15625" west of the NE corner at an azimuth of 147°. This seems intimidating at first because of the 15625", but remember that you are working with a scale of 1:15625, so this only means that the line enters 1 inch west of the NE corner of the square. Now measure the azimuth like in step 1, and make a mark at 147°. This is a power transmission line, which means it is a thin solid line connecting small solid dots. Since it does not specify the number of poles or towers, assume that only poles are present, and include them at a reasonable spacing.
- Draw a graticule tick mark in the NW 1/4 NW 1/4 12. An easy one to finish it off! A graticule tick mark is simply a plus sign, since it marks the intersection of important geographic coordinates. Just find "NW 1/4 NW 1/4 12", which is the top left corner of the whole square, and put a plus sign anywhere.
Congratulations, you have completed your first map! Student-created map exercises can vary greatly in difficulty and scope, so it's important to practice a wide variety of exercises. Most practice tests available will have an example, which can be used for practice. And as always, practice makes perfect; with more practice, you can get more skilled at making maps quickly, efficiently, and accurately, which can set apart a great team from a good one.
Here is the answer key:
Map Drawing Answer Key

|
Satellite Images
This section is incomplete. |
For this portion of the event, students must analyze satellite images and answer questions about them. This portion is similar in some ways to other portions.
Feature Identification
In this portion, students must be able to identify features of satellite images.
Bodies of Water
Bodies of water consist of lakes, rivers, streams, and oceans. These are fairly easy to identify because they are often unique shapes and shades of blue.
Let's take a look at a sample image with water.

It is clear that the segments of blue are rivers and the large area of blue is an ocean. But there is still more to bodies of water. In tropical areas where water is pure, such as areas in Florida, you will see patches of light and dark blue. This is the difference in sediment.

Sediments are deposits of sand, mud, or other small particles. They reflect light to color the water. Without it, in the open ocean, there is less reflection so the water appears darker.
Vegetation
Vegetation consists of all plant material. Trees, grass, and farmland all fall into this category. Vegetation is usually easy to identify because it is usually a shade of green. Grasslands are a slightly lighter green while forests are dark green due to the population density. Finally, farmlands are usually quadrilateral shaped and range from green to pale yellow. See the example below.

Also, vegetation can have different appearances based on seasons. In summer, vegetation is a full green. In spring, vegetation is a paler green. In winter, vegetation is usually white with very pale mint green. And finally, in Autumn, vegetation is what you would expect: hues of red, brown, and orange.

Bare Ground
Bare ground consists of places where there is little to none vegetation. As one might expect, it is usually a shade of brown on a satellite image.

The color of the bare ground depends on the mineral content of the soil. For example, soil can be red because of the presence of iron oxide in the soil, and in places where soil is very pale, there is an abundance of silicon, calcium, and/or sodium chloride. The image below is an example of this.

Civilization
Of course, on a satellite map there isn't only going to be natural features. The impact of human civilization has left cities, towns, and other places of residency. An easy way to identify civilization is looking for densely packed locations on a map that usually do not contain many colors other than white. Also, most major cities have a "spoke and wheel" look where there seem to be lines extending from one central point. This is because of the roads leading into and out of the city (the spokes) and a loop highway around the city (the wheel).

Distances and Scales
In this portion, competitors utilize scales on the provided map to determine distance and other related measurements. As the name might suggest, this section is very similar to the topographic and highway map sections of the event as far as distances and scales go.
Usually, a scale is found in a corner of the map, such as in the lower right corner in the case of Google Maps. To find the distance from one point to another, a process similar to the process of doing so on a topographic or highway map is used. Students may want to use a scrap of paper on which to copy the scale given, then they will be able to use the paper as a ruler or straightedge to measure the distance from one point to another.
In the case that a scale is not given, rarely, another way to determine distance is to approximate. Although this does not seem reliable at first glance, there is some given information regarding distance. For example, the distance between interchanges with consecutive exit numbers on highways is approximately one mile. Using this information, one can measure the distance between one interchange and another to approximate the length of one mile on a satellite
Time of Day
In this portion, competitors must use the information on a satellite map to approximate the time of day the satellite map was taken.
The most common way of approximating the time of day on a satellite map is to observe the shadow projection of objects. Since satellite maps are usually oriented so that it aligns with the arms of a compass rose, north on a satellite map is north in real life. Because the sun revolves around us (in our perspective), we can come to the conclusion that the shadow of an object can align with a clock to give us the time of day. For example, if the shadow of an object projects directly north, then the time of day is either midnight or midday, depending on the lighting in the given area.
For example, in the picture below, we can observe the trees to see that the shadows point to about an azimuth of 300 degreees. Iff we draw an imaginary clock over it and let the shadow be the hour hand, then it would be pointing to 10. Therefore, we can approximate the time to be around 10:00 AM. For this to work, north must be facing up.

Tips for the Competition
- It is wise to split the test relatively evenly while in a competition because of the time limit. 50 minutes may seem like a long time, but time can fly by in the competition.
- Try to use different state maps while practicing to get more experience with different states and terrain. Additionally, purchase or find different tests for practice. Finally, try to memorize important formulas such as: stream gradient, slope gradient, UTM, latitude and longitude, conversions, etc.
- Teams are allowed to bring a binder, so there’s no reason to come to a competition unprepared. If the binder contains lots of information, make an index to make it easier to find information. You may also want to bring the following crucial equipment: A ruler, a protractor, pencils, scratch paper, a calculator (preferably a TI-30X or TI-34), a length of string for measuring distances, a (USGS) map symbol sheet, and perhaps a magnifying glass for locating objects in small print.
- Don’t hesitate to ask if you are missing materials or need clarification on a test question. The event supervisors should have no reason to disqualify you if you need a map or want clarification on the wording of a question.
- Pay attention. It’s easy to accidentally misread NE as NW, for example. Always make sure to identify what the test is asking and how to write the proper answer for every question. You should also double-check the answers, if time allows.
- Practice your identification skills with games such as “I Spy”. It will pay off when trying to locate a hard-to-find object on the map.
- The majority of the time, the Road Scholar test will be in a story-format, with the answers being certain words of the story that have been omitted. Usually the first page of the test will have no questions and all background into the characters in the story. Although some of the problems may need context, it is not wise to read the entire story, as that sucks up valuable time. Go to the first question immediately, read the few lines before the question and, if more context is needed, go back further.
- Familiarize with, as well as bring a copy of, the USGS Topographic Map Symbols sheet. Sometimes, a question will have something to do with an obscure object that you will not know the symbol for. With this "cheat sheet," you can quickly find the symbol in question, and that will be very helpful in the search of that object.
Practice
Participants should become familiar with reading topographic maps as well as road maps, and knowing what symbols mean on a map. See the USGS website for a list of road map symbols. A good study tool is the coaches’ handbook which goes in depth into all of the important topics.
Many practice tests can be found in the Test Exchange Archive, along with many other practice tests for many other events. Maps may need to be ordered from USGS to complete the tests.
Profiling Exercises
Most of these profiling exercises can be used multiple times. Just change the points between which the profile is being made to make it easier or harder.


Practice Tests
- User:Builderguy135 and User:Sciolyperson1's Road Tests 2020:
External Links
- Includes some general information, how to make a topographic profile, measuring stream gradient, and a sample map.
- How to profile
- More Information
- Understanding UTM.